Case Study
Supply Chain Performance & Inventory Risk Intelligence
Data Analyst
Built an end-to-end supply chain intelligence dashboard tracking delivery performance, inventory health and supplier risk to enable proactive decisions.
01 / Business Problem
The challenge.
Supply chain leaders lacked a unified view of delivery performance, inventory health and supplier risk — making it hard to spot stockout risks, late shipments and underperforming suppliers before they hit revenue.
02 / Dashboard Gallery
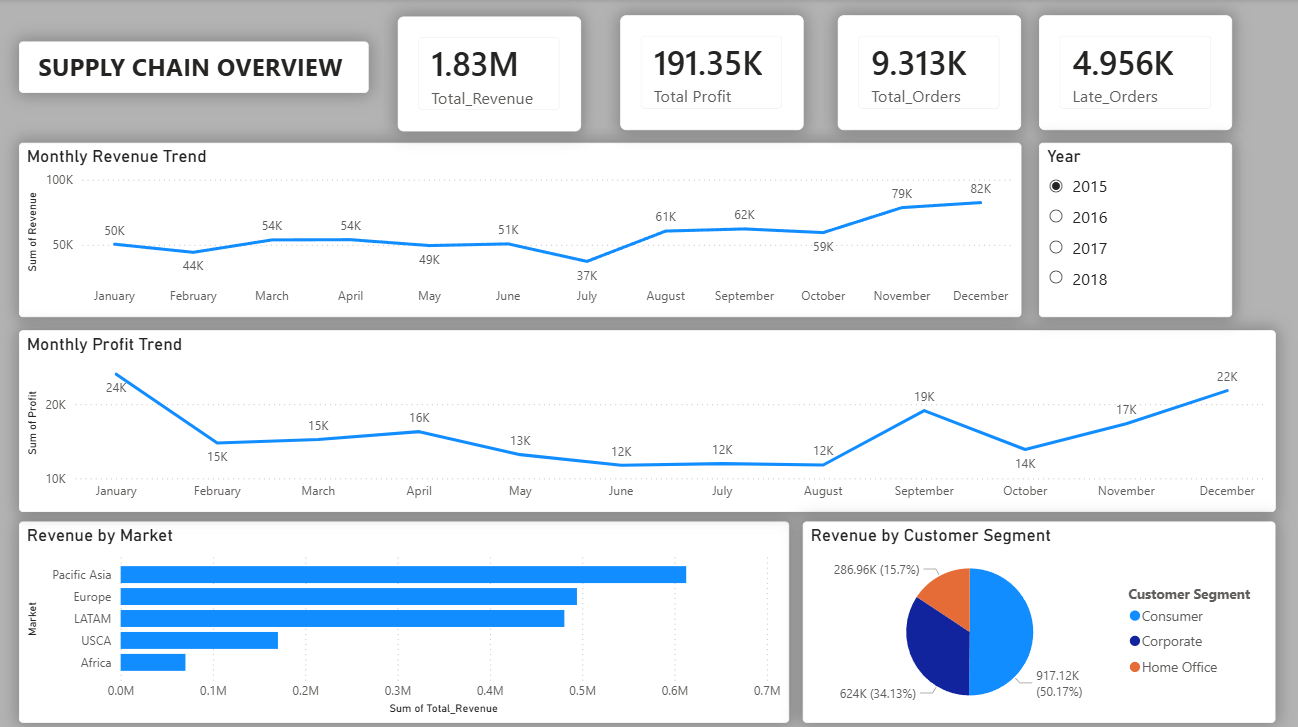
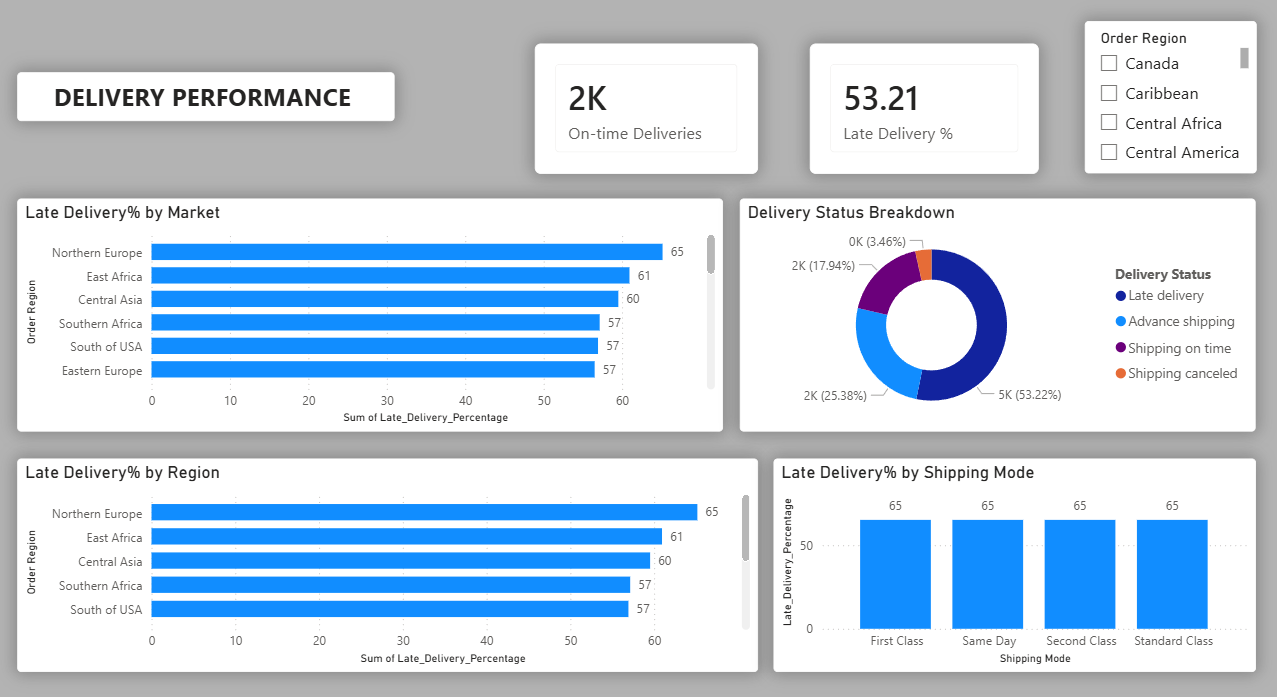
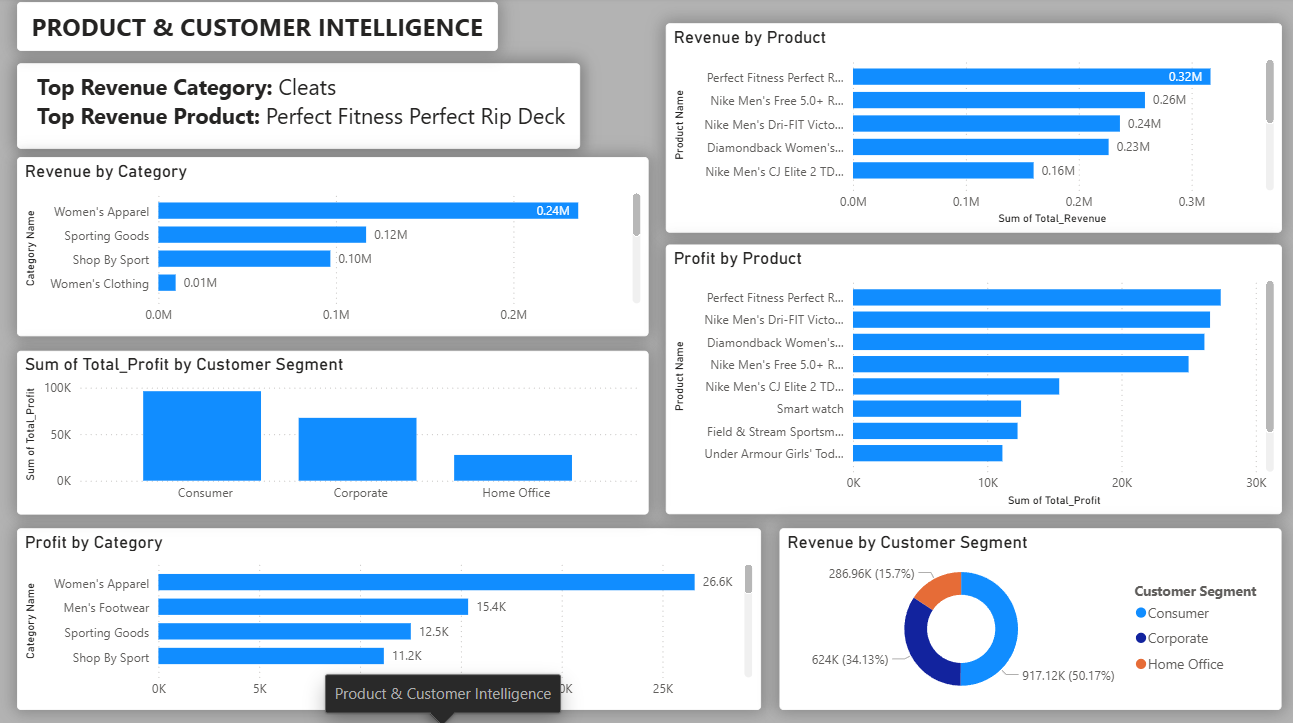
Dashboards & visualizations.
Interactive reports that turn the analysis into decisions stakeholders can act on.
03 / Data Source
Where the data came from.
Operational supply chain dataset covering shipments, warehouses, suppliers and SKU-level inventory, combined with supplier scorecards and lead-time logs.
Multi-table dataset with shipment-level records (origin, destination, carrier, lead time, on-time status), SKU inventory snapshots, supplier master data with risk attributes, and historical demand by region.
04 / Methodology
How the analysis was built.
Data Cleaning
Consolidated shipment, inventory and supplier tables, standardized location and SKU codes, removed duplicate shipment events and engineered lead-time, on-time-flag and risk-tier fields.
SQL Analysis
Wrote SQL with CTEs and window functions to compute on-time delivery %, rolling lead times, inventory turnover, days-of-supply and supplier risk scores; validated against operational benchmarks.
Dashboard Development
Built a multi-page Power BI report — executive KPI overview, warehouse and route performance, inventory health, and a supplier risk page with drill-through to SKU-level stockout risk.
05 / Key Insights
What the data revealed.
On-time delivery drops ~9 points on long-haul routes through two specific transit hubs — a clear bottleneck.
Roughly 18% of SKUs drive 80% of stockout incidents, concentrated in fast-moving categories with low safety stock.
Top 12 suppliers contribute 65% of late shipments, mostly tied to extended lead-time variability.
Regional demand spikes are predictable from prior-month patterns but inventory is not pre-positioned accordingly.
06 / Recommendations
What the business should do next.
Reroute long-haul shipments away from the two bottleneck hubs or add a buffer transit day in planning.
Raise safety stock on the top 18% stockout-prone SKUs and review reorder points monthly.
Move the 12 high-risk suppliers to a weekly performance review and qualify backup suppliers for critical SKUs.
Pre-position inventory in high-demand regions based on the rolling 3-month demand forecast.
07 / Technologies
The stack.
Explore the code
Dive into the repository.
More work
Other projects
Airline Delay Analysis
Analyzed airline delay data to identify patterns by airline, route, airport, and time, with visuals comparing airline performance.
Gym Workout Analysis
Analyzed workout data to understand exercise patterns, training consistency, calories burned, and performance trends.
AI-Powered A/B Testing Analysis
Built an AI-assisted A/B testing project comparing product versions by analyzing user behavior, conversion rates, and performance differences.