Case Study
Airline Delay Analysis
Data Analyst
Analyzed airline delay data to identify patterns by airline, route, airport, and time, with visuals comparing airline performance.
01 / Business Problem
The challenge.
Airline delays cost the industry billions annually and erode customer trust. Operations and customer-experience teams needed a clear, evidence-based view of where, when, and why delays happen so they could prioritize route, schedule, and staffing improvements.
02 / Dashboard Gallery
Dashboards & visualizations.
Interactive reports that turn the analysis into decisions stakeholders can act on.
03 / Data Source
Where the data came from.
Public US Bureau of Transportation Statistics (BTS) on-time performance dataset, supplemented with airport and carrier reference tables.
Over 3M domestic flight records across 14 major carriers and 300+ airports. Fields include scheduled/actual departure & arrival times, delay reasons (carrier, weather, NAS, security, late aircraft), cancellations, distance, and route metadata.
04 / Methodology
How the analysis was built.
Data Cleaning
Removed duplicate and cancelled-flight noise, standardized timezone-adjusted timestamps, imputed missing delay-reason fields and engineered derived columns (delay buckets, hour-of-day, day-of-week, season).
SQL Analysis
Wrote modular SQL queries with CTEs and window functions to compute on-time KPIs, rolling averages, percentile delays per carrier, and route-level rankings. Validated metrics against BTS published benchmarks.
Dashboard Development
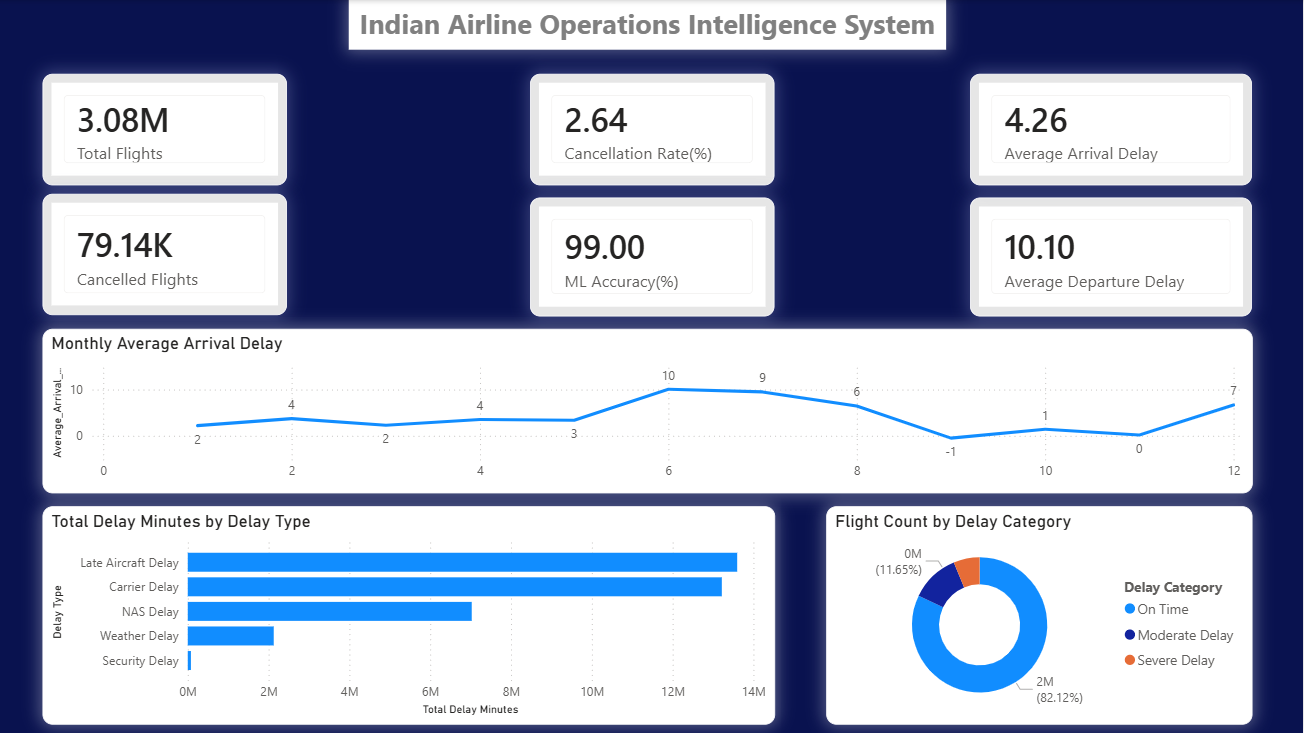
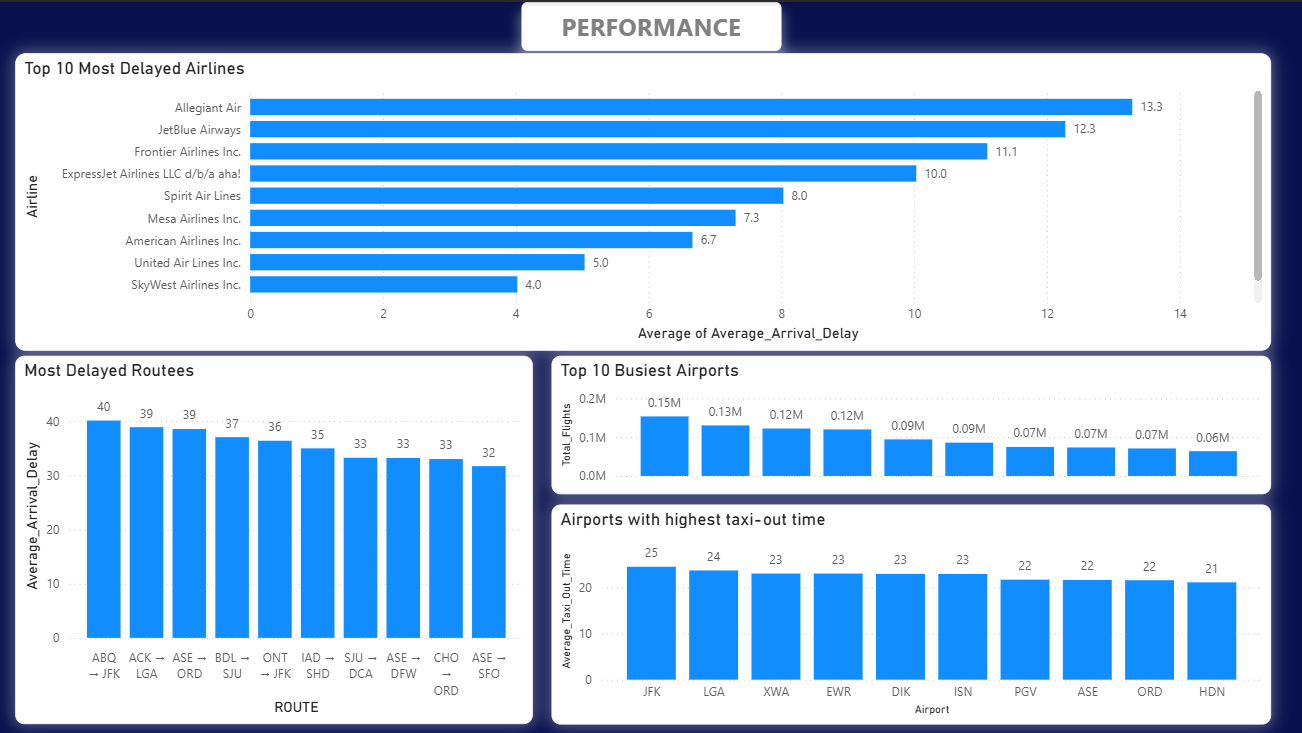
Built an interactive Power BI report with cross-filtered visuals — executive KPI strip, carrier comparison, time-series trends, geographic heatmap of airport delays and a route drill-down page.
05 / Key Insights
What the data revealed.
Late-arriving aircraft and carrier-controlled issues together account for over 60% of all delays — far more than weather.
Evening flights (after 5 PM) carry ~2.4× the delay risk of early-morning flights due to cascading schedule slippage.
Five hub airports drive a disproportionate share of network-wide delay minutes.
Short-haul routes under 500 miles show higher on-time performance but higher cancellation rates in winter months.
06 / Recommendations
What the business should do next.
Tighten turnaround buffers at the top 5 delay-contributing hubs to break the late-aircraft cascade.
Re-balance crew and gate resourcing for evening banks at peak carriers to reduce post-5 PM delay risk.
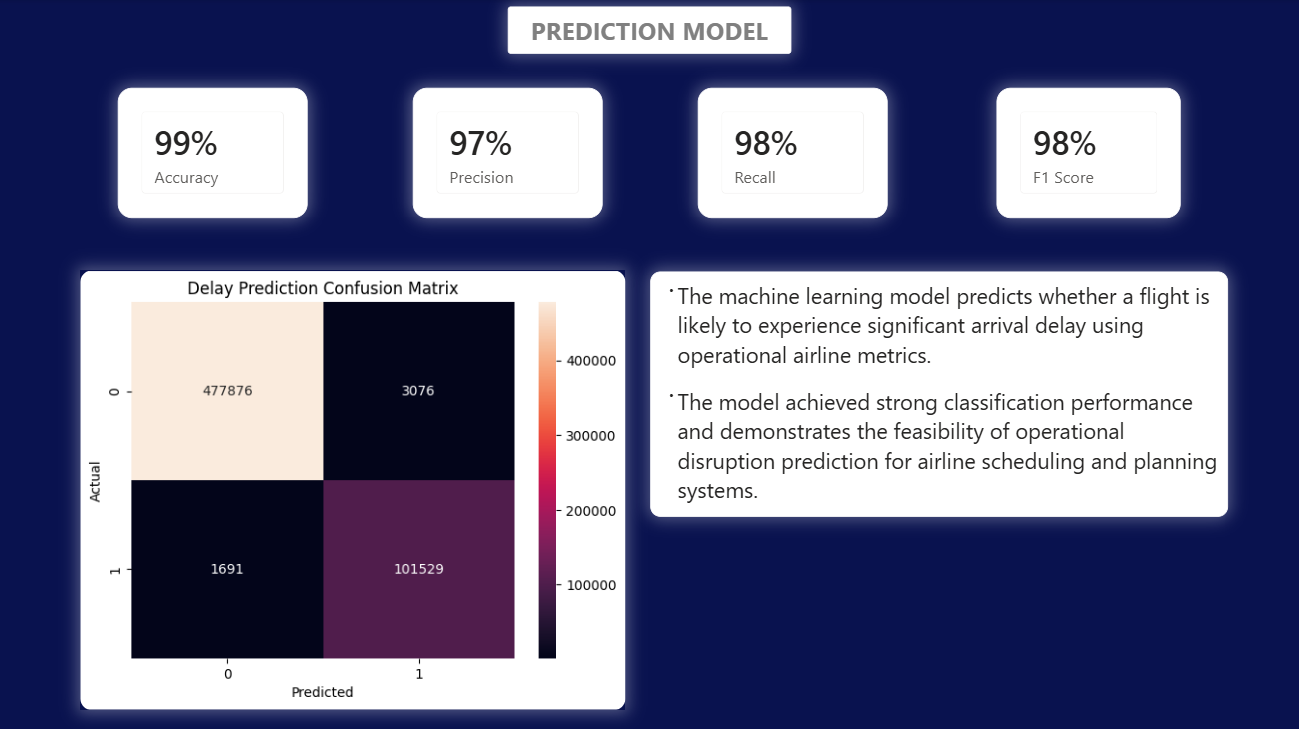
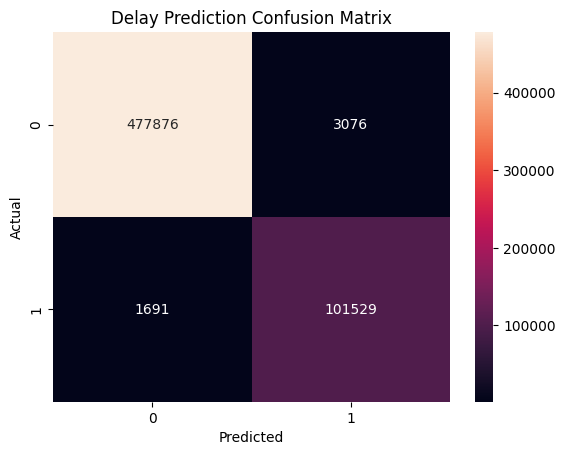
Add proactive customer comms triggers when delay probability for a flight exceeds 30% based on time/route/carrier.
Negotiate slot adjustments on routes consistently in the bottom decile of on-time performance.
07 / Technologies
The stack.
Explore the code
Dive into the repository.
More work
Other projects
Supply Chain Performance & Inventory Risk Intelligence
Built an end-to-end supply chain intelligence dashboard tracking delivery performance, inventory health and supplier risk to enable proactive decisions.
Gym Workout Analysis
Analyzed workout data to understand exercise patterns, training consistency, calories burned, and performance trends.
AI-Powered A/B Testing Analysis
Built an AI-assisted A/B testing project comparing product versions by analyzing user behavior, conversion rates, and performance differences.